(pdf)version
Summary Report
Consumer Satisfaction Survey
Kentucky Department of Vocational Rehabilitation
2001
Submitted to: Statewide Council for Vocational Rehabilitation
Consumer Satisfaction Subcommittee
Prepared by:
Kathy Sheppard-Jones, M.R.C., C.R.C.
And
Christy Howard
Interdisciplinary Human Development Institute
University of Kentucky
EXECUTIVE SUMMARY
For the sixth year, the Interdisciplinary Human Development Institute (IHDI) at the University of Kentucky has coordinated the annual Kentucky Department of Vocational Rehabilitation Consumer Satisfaction Survey at the request of the Statewide Council for Vocational Rehabilitation (SCVR). This year, the University of Kentucky Survey Research Center successfully contacted 1060 consumers by telephone to participate in the survey with a response rate for eligible participants of 80.2%.
True to the pattern of the past few years, those consumers whose cases were closed with a positive employment outcome (group A) were more consistently satisfied in almost all areas than other respondents. Approximately 93% of consumers with status A case closure felt that Vocational Rehabilitation services were good or very good. This is one-half percentage point (0.5%) higher than last year.
Overall, 85.5% of all consumers surveyed stated that services were good or very good. The average satisfaction level for all respondents was 3.28 on a four-point scale. This represents a slight decrease from the average score of 3.33 in the 2000 survey. Eighty-nine percent of all consumers whose cases were closed in fiscal year 2001 indicated that they would return to Vocational Rehabilitation in the future if needed.
About 72% of those in group A were employed either full or part time when this survey was administered. This is substantially higher than those in group B (consumers with cases closed after initiation of Individualized Plan for Employment), in which less than one-quarter of those surveyed were working either full or part time. In addition, those in group A worked more hours, were more likely to receive benefits at their jobs, and were more satisfied with their work and pay than consumers who did not achieve a positive employment outcome. A small percentage (10.6%) of those in group A were not employed nor looking for employment, and 2.2% of those in group A were retired at the time of the survey.
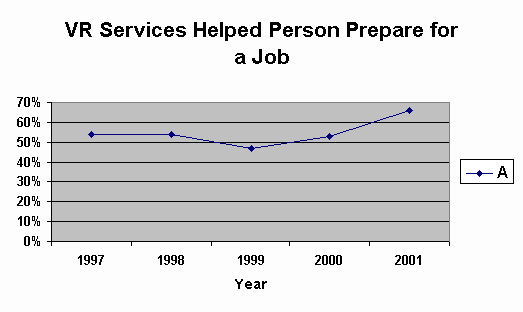
One question in this year’s survey was reworded slightly. In previous surveys, participants were asked, "Did vocational rehabilitation services help you get your current job?". This year, the SCVR opted to change the question to, "Do you feel that vocational rehabilitation services helped prepare you for a job?". About two-thirds of consumers in group A agreed that Vocational Rehabilitation services were of help in this endeavor compared with 52.6% of last year’s respondents. It is felt that the reconstructed question is more understandable. This is reflected by the increased level of agreement by consumers who would be more likely to agree that the Department had some level of involvement in their successful employment outcome.
With regard to case closure, less than 60% of consumers who did not have a positive employment outcome reported being informed that their cases had been closed, and approximately one third of them thought that their cases should not have been closed. In contrast, about three-quarters of those in group A reported that they were informed when their cases were closed, and less than 20% thought that their cases should not have been closed. As a related indicator, nearly 93% of those who had achieved a positive employment outcome while a consumer of the Department indicated that they would return to the Department in the future if they needed help again.
The 2001 report contains a comparisons of selected questions from 1997 – 2001 in Appendix A.
Summary Report Prepared by: Kathleen Sheppard-Jones 859.257.8104
Christy Howard 859.257.5012
Project Director: Barney Fleming 859.257.7225
Funding Source: Kentucky Department of Vocational Rehabilitation
Summary Report
Consumer Satisfaction Survey
Kentucky Department of Vocational Rehabilitation
2001
The Kentucky Department of Vocational Rehabilitation, at the request of the Statewide Council for Vocational Rehabilitation (SCVR), contracted with the Interdisciplinary Human Development Institute (IHDI) at the University of Kentucky to provide information to the Department regarding the experiences of consumers of Vocational Rehabilitation who had cases closed in fiscal year 2001. The University of Kentucky Survey Research Center (UKSRC) contacted a sample of consumers by telephone from December 21, 2001 through January 24, 2002 with a target of 1000 completed interviews. The sample was drawn randomly, but stratified to appropriately reflect the proportions of consumers with cases closed among four closure categories. Of the 1,322 eligible consumers who were contacted, 1060 consumers (representing all four case closure categories and all districts of Kentucky) completed the survey. The response rate for this year's survey was 80.2%.
For the remainder of this report, consumer closure status groups will be referred to in the following manner:
A Closed with Positive Employment Outcome (PEO)
B Closed for other reasons after the Individualized Plan for Employment (IPE) was initiated
C Closed for other reasons before the IPE was initiated
D Closed from referral, applicant, or extended evaluation
Number of Respondents by Case Closure Category
|
Closure Category Group |
Number of Respondents |
% |
Legend Color |
|
A |
404 |
38.1 |
|
|
B |
197 |
18.6 |
Red |
|
C |
225 |
21.2 |
Yellow |
|
D |
234 |
22.1 |
Lt Blue |
|
Total |
1060 |
100 |
Those consumers who had achieved positive employment outcomes (group A) represented the largest group in the sample at almost 40%. Groups B, C, and D each consisted of about 20% of the sample.
Closure Status by District
The state is divided into 12 Districts, with the western part of the state having lower district numbers, and the eastern region of the state having higher district numbers. Paducah represents District 1, Louisville in District 5, Lexington in District 9, and Ashland in District 12. A complete list of counties and their corresponding districts is presented in Appendix C.
Like last year, District 9, which includes Lexington, had the highest percentage of respondents at 14.8%, followed by District 5, which includes Louisville at 12.2%. District 12, which includes Ashland and Morehead, had the fewest respondents with only 4% of the sample’s total respondents. The table below indicates response frequencies by District for each category as well as the total sample.
Respondents by District
|
District |
Location |
A |
B |
C |
D |
TOTAL |
TOTAL % |
|
1 |
Paducah, Murray |
25 |
5 |
16 |
17 |
63 |
5.9 |
|
2 |
Madisonville, Hopkinsville |
34 |
11 |
9 |
12 |
66 |
6.2 |
|
3 |
Owensboro |
41 |
10 |
11 |
18 |
80 |
7.5 |
|
4 |
Bowling Green |
45 |
6 |
11 |
26 |
88 |
8.3 |
|
5 |
Louisville |
41 |
24 |
39 |
25 |
129 |
12.2 |
|
6 |
Elizabethtown, Shepherdsville |
50 |
18 |
23 |
26 |
117 |
11 |
|
7 |
Frankfort, Danville, Somerset |
31 |
27 |
23 |
16 |
97 |
9.2 |
|
8 |
Northern Kentucky |
26 |
5 |
17 |
8 |
56 |
5.3 |
|
9 |
Lexington |
47 |
39 |
36 |
35 |
157 |
14.8 |
|
10 |
Prestonsburg, Pikeville |
28 |
36 |
19 |
28 |
111 |
10.5 |
|
11 |
Harlan, Corbin, Hazard |
17 |
7 |
16 |
14 |
54 |
5.1 |
|
12 |
Ashland, Morehead |
19 |
9 |
5 |
9 |
42 |
4 |
|
Total |
404 |
197 |
225 |
234 |
1060 |
100 % |
Respondent Demographics
Respondents were well matched with regard to gender representation. Half of the sample (50.4%) was female, and half (49.6%) was male.
The average age of consumers across all closure categories was 35.8 years old.
With regard to race, 90% reported to be white, 9.4% African American, 0.3% Asian/Pacific Islander and 0.3% American Indian/Alaskan Aleut.
Race
Educational levels are shown in the following table. Approximately one-quarter of survey participants did not graduate from high school. About half (49.1%) of the respondents reported graduating high school or receiving a GED. Nearly one-fourth of respondents did continue their education past high school. Less than one-half of one percent of consumers reported having no schooling.
|
Education Level |
Number of Respondents |
% of Respondents |
|
Never Went to School |
4 |
0.4 |
|
Grade School |
52 |
4.9 |
|
Some High School |
204 |
19.3 |
|
High School Graduate/GED |
520 |
49.1 |
|
Some College |
181 |
17 |
|
College Graduate |
44 |
4.2 |
|
Graduate School |
16 |
1.6 |
|
No Response |
39 |
3.7 |
|
TOTAL |
1060 |
100 |
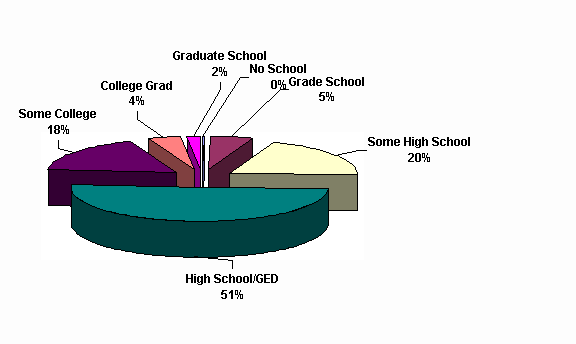
It’s notable to mention that for those of this sample who did continue their education beyond the high school level, almost half (46%) had achieved positive employment outcomes, compared to one-third (35%) of those who did not complete high school or receive their GED. For those of this sample who continued their education beyond that of the undergraduate college level, the chance of positive employment outcomes increased to 75%. Similarly, for this sample, completing graduate school nearly guaranteed a positive employment outcome (n=11, 90.9%).
Consumers were asked how they learned about the Department of Vocational Rehabilitation. The five choices represented below were given.
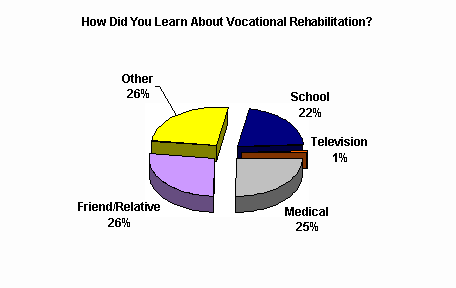
Those who responded that they had learned about Vocational Rehabilitation in some other way were then asked how they learned about services. Some of the other ways consumers reported learning about Vocational Rehabilitation services included: social security office, employer, military, financial aid office, worker's compensation, social worker, Comprehensive Care office, was contacted by Vocational Rehabilitation staff, Department for Employment Services, Easter Seals, drug and alcohol rehabilitation center, telephone book, passed by on street, crisis center, newspaper, court system, attorney, literature, Veteran’s Administration, the Internet, billboard, Cardinal Hill Rehabilitation Center, workshop, Charter Ridge, religious organization, and Frazier Rehabilitation Institute.
Overall Service Quality
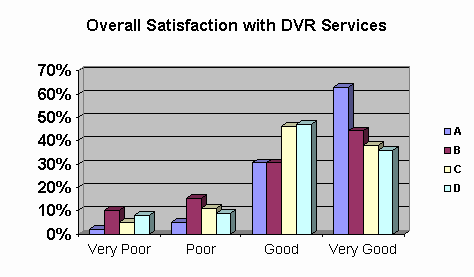
The question that continues to have the greatest level of interest to the SCVR and the Department concerns overall service quality. As occurred last year, all respondents were asked to rate the overall quality of the services they received from the Department of Vocational Rehabilitation. Responses were rated on a four-point scale (1 = very poor, 2 = poor, 3 = good, and 4 = very good) to calculate a mean or average score.
Regardless of case closure status, the majority of respondents indicated that overall services provided by the Department were good or very good (85.5%). However, the overall rating is higher for those individuals who had achieved a positive employment outcome (93.3%). As has been the case over the past several years, those respondents who were able to obtain employment were more likely to be satisfied with the services provided through the Department of Vocational Rehabilitation than were those respondents who did not have a positive employment outcome.
For those individuals whose cases were closed prior to the initiation of services, this question referred to their overall feelings about the vocational rehabilitation system and professionals with whom they interacted.
Satisfaction with Overall Service
|
Closure Category |
Very Poor % |
Poor % |
Good % |
Very Good % |
Mean Rating |
|
A (n=400) |
1.8 |
5.0 |
30.5 |
62.8 |
3.54 |
|
B (n=197) |
10.2 |
15.2 |
30.5 |
44.2 |
3.09 |
|
C (n=221) |
5.0 |
10.9 |
46.2 |
38.0 |
3.17 |
|
D (n=221) |
8.1 |
9.0 |
47.1 |
35.7 |
3.1 |
|
Overall |
5.4 |
9 |
37.3 |
48.2 |
3.28 |
Overall Satisfaction By District
The range of overall satisfaction by district showed a high of 3.56 in District 12, which includes Ashland and Morehead, and a low of 3.09 in District 8 which includes the Northern Kentucky area. However, none of these differences were found to be statistically significant. In addition, District 12 had the lowest percentage of respondents in this survey at 4%.
|
District |
N |
Mean Rating |
|
1 |
62 |
3.23 |
|
2 |
64 |
3.23 |
|
3 |
77 |
3.44 |
|
4 |
87 |
3.2 |
|
5 |
125 |
3.27 |
|
6 |
115 |
3.41 |
|
7 |
97 |
3.28 |
|
8 |
56 |
3.09 |
|
9 |
152 |
3.16 |
|
10 |
110 |
3.35 |
|
11 |
53 |
3.3 |
|
12 |
41 |
3.56 |
Overall consumer satisfaction with DVR services by closure category
A Consumer case closed PEO (n=400)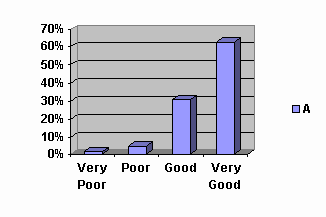
Very poor 1.8%
Poor 5.0%
Good 30.5%
Very good 62.8%
Mean = 3.54
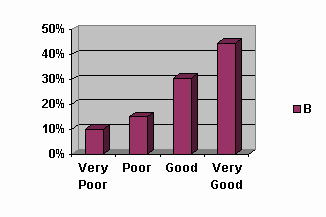
B Consumer case closed after initiation of IPE (n=197)
Very poor 10.2%
Poor 15.2%
Good 30.5%
Very good 44.2%
Mean = 3.09
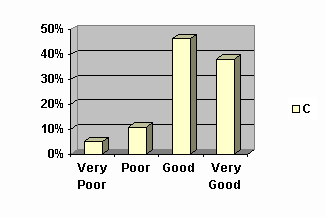
C Consumer case closed prior to initiation of IPE (n=221)
Very poor 5.0%
Poor 10.9%
Good 46.2%
Very good 38.0%
Mean = 3.17
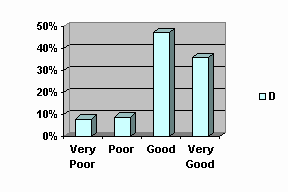
D Consumer case closed in referral, applicant, or extended evaluation (n=221)
Very poor 8.1%
Poor 9.0%
Good 47.1%
Very good 35.7%
Mean = 3.10
Specific Service Ratings
The following table shows consumers’ mean satisfaction level of specific services. This information was given by those whose cases were closed with a positive employment outcome (group A) as well as individuals whose cases were closed after the initiation of the IPE (group B). These questions were not asked of consumers with cases closed before initiation of the IPE (group C or group D), as no services were received through the Department. Individuals were asked to rate the services received from strongly dissatisfied to strongly satisfied (a four-point scale was again used). Those who did not receive the service or did not answer the question were not included in the calculation.
All consumers with positive employment outcomes (group A) rated every individual service higher than those with cases closed for other reasons after initiation of the IPE (group B). The people representing group A indicated the highest levels of satisfaction with the following services: educational, vocational, counseling, and the Carl D. Perkins Rehabilitation Center. Job placement and mental health services received the lowest ratings from consumers in group A. Group B rated educational, medical, and the Carl D. Perkins Rehabilitation Center highest. These consumers rated job placement, employment support, and job training the lowest.
Rating of Specific Services
|
Service |
A Mean Rating |
B Mean Rating |
|
Counseling |
3.19 (n=312) |
2.88 (n=161) |
|
Educational |
3.25 (n=296) |
2.97 (n=149) |
|
Vocational |
3.19 (n=273) |
2.87 (n=142) |
|
Transportation |
3.14 (n=139) |
2.79 (n=78) |
|
Mental Health |
3.02 (n=139) |
2.82 (n=91) |
|
Job Training |
3.11 (n=210) |
2.77 (n=127) |
|
Technology |
3.08 (n=172) |
2.89 (n=105) |
|
Job Modification |
3.09 (n=188) |
2.81 (n=98) |
|
Employment Support |
3.07 (n=248) |
2.69 (n=118) |
|
Job Placement |
2.95 (n=223) |
2.60 (n=108) |
|
Advocacy |
3.11 (n=194) |
2.84 (n=111) |
|
CDPCRC * |
3.19 (n=176) |
2.90 (n=110) |
|
Medical |
3.18 (n=186) |
2.92 (n=114) |
|
Other |
3.21 (n=213) |
2.87 (n=99) |
*
Carl D. Perkins Rehabilitation CenterReplicating the process from the past several years, consumers were asked a series of questions related to their experiences with their counselor and the Vocational Rehabilitation office. Responses to these questions were rated on a Likert scale according to the following: strongly disagree = 1, disagree = 2, agree = 3, or strongly agree = 4.
Nearly all respondents (95.2%), regardless of case closure status, agreed or strongly agreed that their counselor’s office was physically accessible.
The Vocational Rehabilitation office was physically accessible to me.
|
A (n=399) |
B (n=192) |
C (n=207) |
D (n=210) |
Overall |
|
|
Mean Range |
3.32 |
3.13 |
3.18 |
3.23 |
3.24 |
The Vocational Rehabilitation office was physically accessible
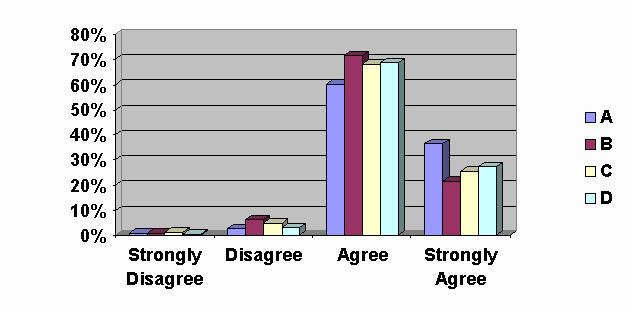
Nearly all respondents (93.7%), regardless of case closure status, agreed or strongly agreed that materials they received from the Department were in an accessible format.
All materials I received from Vocational Rehabilitation were in an accessible format (ex., Large Print, Tape Recording or Braille).
|
A (n=366) |
B (n=168) |
C (n=192) |
D (n=191) |
Overall |
|
|
Mean Range |
3.30 |
3.01 |
3.07 |
3.14 |
3.17 |
All materials were in an accessible format
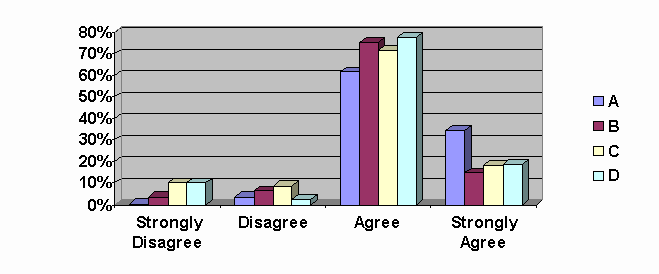
Consumers in group A reported the highest levels of agreement with regard to ability to see their counselors in a reasonable amount of time when they scheduled an appointment. Overall, 90.7% of consumers agreed or strongly agreed that they were able to get an appointment in what they considered to be a reasonable amount of time.
I was able to get an appointment with my counselor in a reasonable amount of time.
|
A (n=395) |
B (n=193) |
C (n=206) |
D (n=218) |
Overall |
|
|
Mean Range |
3.33 |
3.0 |
3.06 |
3.14 |
3.17 |
I was able to get an appointment in a reasonable amount of time
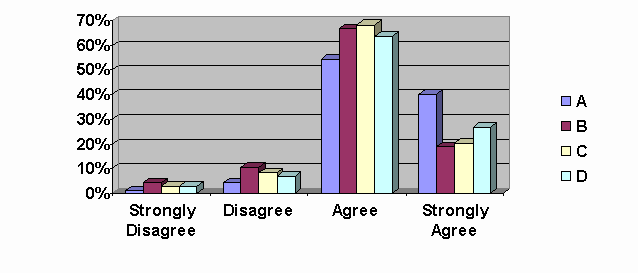
Regardless of case closure status, most consumers (93.8%) agreed or strongly agreed that they were treated courteously by Department staff.
I was treated courteously by all staff.
|
A (n=401) |
B (n=195) |
C (n=220) |
D (n=224) |
Overall |
|
|
Mean Range |
3.45 |
3.08 |
3.22 |
3.24 |
3.29 |
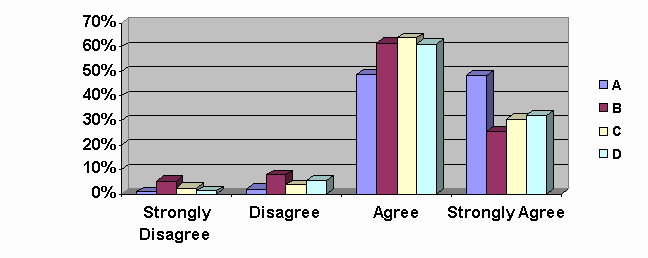
Consumers who had a positive employment outcome reported the highest agreement that their counselors helped them understand their disabilities. Consumers whose cases were closed after the initiation of an IPE rated this item the lowest.
My counselor helped me to understand my disability.
|
A (n=373) |
B (n=186) |
C (n=197) |
D (n=194) |
Overall |
|
|
Mean Range |
3.18 |
2.82 |
2.95 |
2.92 |
3.01 |
My counselor helped me understand my disability
Over 86% of consumers in group A agreed or strongly agreed that their counselors were able to help them understand their strengths and limitations when choosing a job.
My counselor helped me to understand the things I can or cannot do so that I could choose an appropriate job.
|
A (n=358) |
B (n=177) |
C (n=185) |
D (n=184) |
Overall |
|
|
Mean Range |
3.13 |
2.74 |
2.83 |
2.91 |
2.95 |
My counselor helped me understand what I can and cannot do so that I could choose an appropriate job
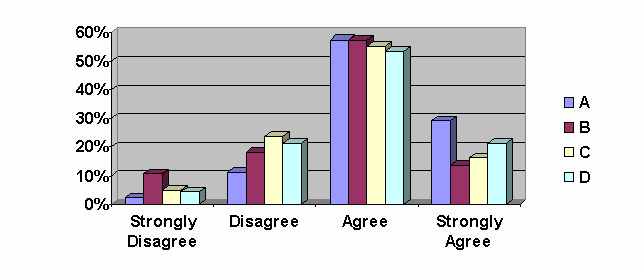
In the area of rights, group A had the highest score for this item indicating that consumers with a positive employment outcome were more likely to agree that their counselor helped them understand their rights.
My counselor helped me to understand my rights.
|
A (n=382) |
B (n=183) |
C (n=197) |
D (n=208) |
Overall |
|
|
Mean Range |
3.20 |
2.93 |
3.02 |
3.03 |
3.08 |
My counselor helped me understand my rights.
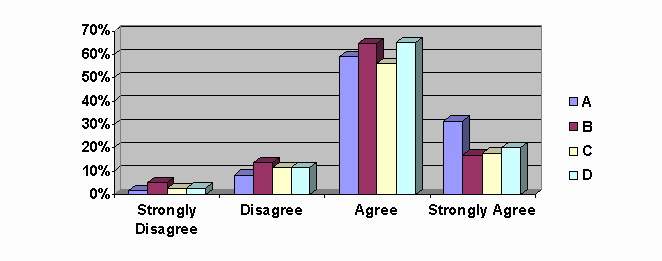
The overall score for the item rating counselor encouragement of consumer participation in service planning reflected no change from last year, however, the mean score for Group A shows a slight increase.
My counselor encouraged me to participate in planning which services I would receive.
|
A (n=371) |
B (n=181) |
C (n=197) |
Overall |
|
|
Mean Range |
3.17 |
2.88 |
2.92 |
3.04 |
My counselor encouraged me to participate in planning…
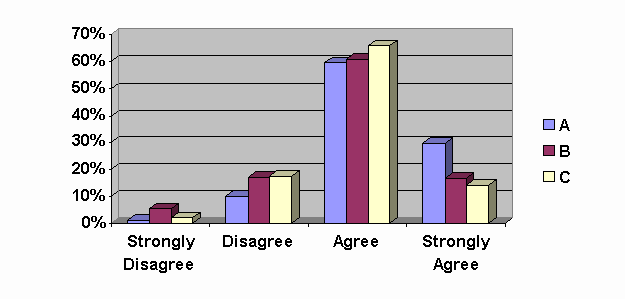
Consumers who had achieved a positive employment outcome (group A) had the best understanding of services that were available from the Department, with 92% agreeing or agreeing strongly. The score for group A reflects a slight increase from that of last year, however the overall score for this item remains unchanged.
My counselor helped me clearly understand the services available to me from Vocational Rehabilitation.
|
A (n=390) |
B (n=191) |
C (n=202) |
Overall |
|
|
Mean Range |
3.23 |
2.90 |
2.97 |
3.08 |
My counselor helped me understand services available…
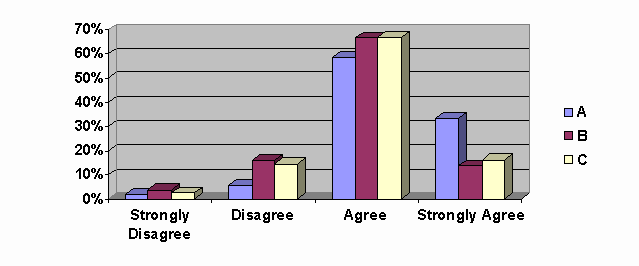
Consumers who received services through the Department were asked about the planning process. Those in group A reported higher agreement when asked if their counselors worked with them to develop a plan.
My counselor helped me to develop a plan of action to get a job or training for a job.
|
A (n=338) |
B (n=177) |
Overall |
|
|
Mean Range |
3.09 |
2.76 |
2.97 |
My counselor helped me develop a plan of action…
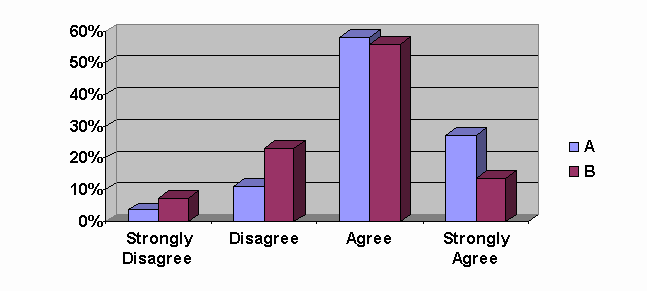
Consumers in group A reported higher levels of agreement with regard to freedom to choose the services that were received. Nearly 95% of consumers in this group agreed or strongly agreed that they felt free to choose services compared to 83% of consumers in group B.
I felt free to choose the type of services I received.
|
A (n=383) |
B (n=186) |
Overall |
|
|
Mean Range |
3.25 |
2.94 |
3.15 |
I felt free to choose the services I received.
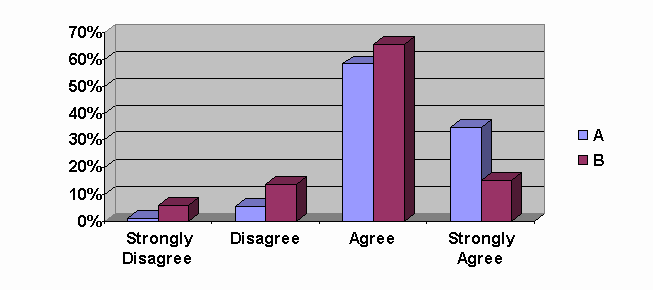
Ninety-three percent of consumers in group A agreed or strongly agreed that services they received through their Individualized Plan for Employment were provided in a timely manner. Only 80% of consumers in group B agreed or strongly agreed with this item. The overall score for this item reveals a slight decrease from last year, although the mean score for group A reveals a slight increase. The mean score for group B reveals a moderate decrease.
The services I received were provided in a timely manner.
|
A (n=393) |
B (n=189) |
Overall |
|
|
Mean Range |
3.27 |
2.89 |
3.15 |
.
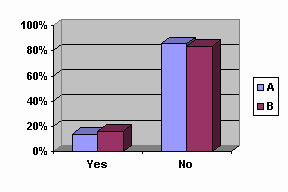
Survey participants in groups A and B were asked if they received Vocational Rehabilitation services while in high school. Fifteen percent of consumers who responded indicated that they had.
Did you receive Vocational Rehabilitation services in high school?
|
A% (n=400) |
B % (n=197) |
Overall % |
|
|
Yes |
14.5 |
16.2 |
15.1 |
|
No |
85.5 |
83.8 |
84.9 |
Did you receive Vocational Rehabilitation services in high school?
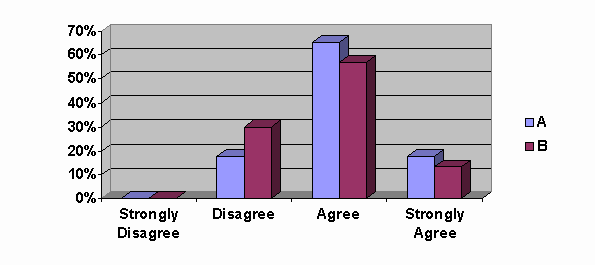
Like last year, those consumers who reported having received services in high school were asked if those services helped them get training or a job. Almost 80% of consumers who responded agreed or strongly agreed.
The Vocational Rehabilitation services I received in high school helped me get training or a job.
|
A (n=52) |
B (n=30) |
Overall |
|
|
Mean Range |
3.0 |
2.83 |
2.94 |
The Vocational Rehabilitation services I received in high school helped me get training or a job.
Employment Information
Following the pattern of the last few years, consumers were again asked about their present employment. Those who responded that they were employed were asked their job title. Diverse answers were given. The largest percentages of job category responses were service (13.1%), skilled trade (i.e. electrical, plumbing, mechanic, etc.)(12.1%), food preparation (10.2%), computing (8.9%), sales (7.4%), administration/management (7%), stenography (4.9%), and education (4.5%). Other responses included clerical, medicine, forestry, agriculture, law, graphic arts, religion, engineering, freight, and transportation.
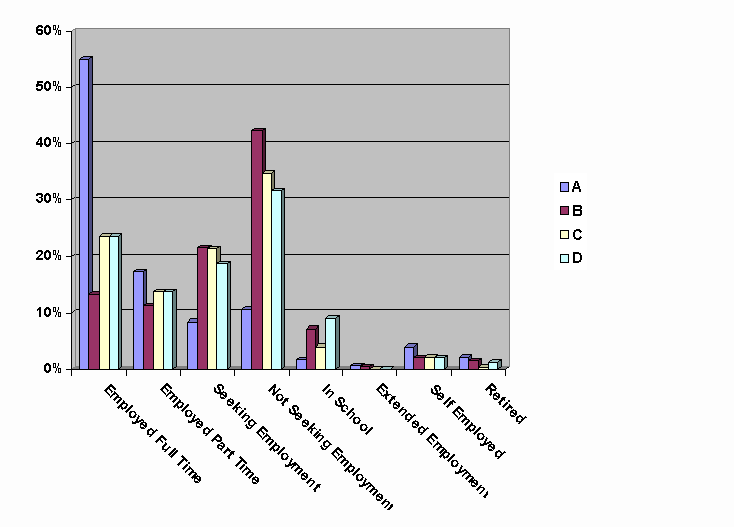
Similar to last year’s data, 55% of those with a positive employment outcome (group A) were employed full time. Just over one-third (33.7%) of the entire sample indicated that they were employed full time. Forty-two percent of those whose cases were closed after initiation of the IPE (group B) were not working nor seeking employment. This category reflects the highest frequency for all groups in this employment indicator.
Employment Status
|
A % (n=404) |
B % (n=194) |
C % (n=225) |
D % (n=234) |
Overall |
|
|
Employed Full Time |
55 |
13.4 |
23.6 |
23.5 |
33.7 |
|
Employed Part Time |
17.3 |
11.3 |
13.8 |
13.7 |
14.7 |
|
Seeking Employment |
8.4 |
21.6 |
21.3 |
18.8 |
15.9 |
|
Not Seeking Employment |
10.6 |
42.3 |
34.7 |
31.6 |
26.2 |
|
In School |
1.7 |
7.2 |
4.0 |
9.0 |
4.8 |
|
Extended Employment |
0.7 |
0.5 |
0 |
0 |
.4 |
|
Self-Employed |
4.0 |
2.1 |
2.2 |
2.1 |
2.8 |
|
Retired |
2.2 |
1.5 |
0.4 |
1.3 |
1.5 |
Employment Status by Group
Those survey participants who reported that they were currently working were asked about their employment earnings. Those belonging to group A are more represented as salary level increases. Approximately 46% of those achieving a positive employment outcome earned $301 or more each week. This is a greater percentage than any other category.
Consumers were asked about earnings from employment
|
Weekly Earnings |
A (%) n=305 |
B (%) n=53 |
C (%) n=89 |
D (%) n=91 |
|
$50 or less |
13.4 |
20.8 |
15.7 |
17.6 |
|
$51 to $100 |
6.9 |
9.4 |
10.1 |
12.1 |
|
$101 to $200 |
17.4 |
28.3 |
24.7 |
16.5 |
|
$201 to $300 |
15.7 |
15.1 |
15.7 |
19.8 |
|
$301 to $400 |
16.1 |
7.5 |
18 |
16.5 |
|
$401 to $500 |
9.2 |
1.9 |
5.6 |
6.6 |
|
$501 to $750 |
13.8 |
9.4 |
6.7 |
5.5 |
|
$751 or more |
7.5 |
7.5 |
3.4 |
5.5 |
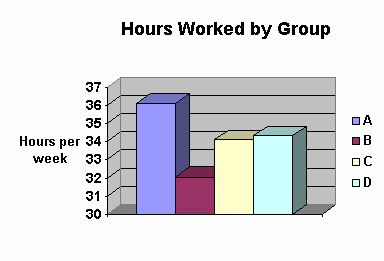
Those who were currently working were asked how many hours they worked each week. Participants with positive employment outcomes (group A) worked an average of 2.6 hours more a week than those in the other status groups.
Average number of hours worked per week:
Consumers in group A (n=302) 36.1
Consumers in group B (n=53) 32.1
Consumers in group C (n=89) 34.1
Consumers in group D (n=92) 34.3
Overall mean hours worked (n=536) 35.1
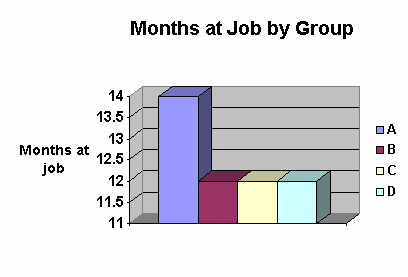
Those who were currently working were asked how long they had been employed at their job.
Number of months at present job (median score):
Consumers in group A (n=306) 14 months
Consumers in group B (n=53) 12 months
Consumers in group C (n=87) 12 months
Consumers in group D (n=91) 12 months
Overall median (n=537) 12 months
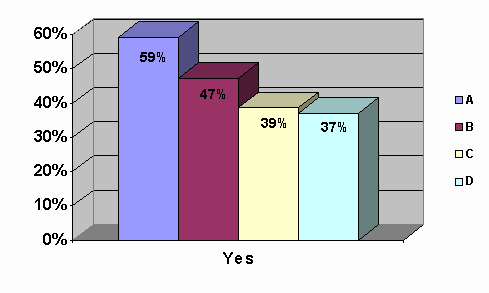
Consumers who were working were asked if they received benefits at their job. Approximately 60% of those with cases closed PEO (group A) did get benefits. This was 15-20% higher than for those in the other status groups.
Do you receive benefits from your job?
|
A% (n=308) |
B% (n=53) |
C% (n=88) |
D% (n=92) |
Overall |
|
|
Yes |
59.1 |
47.2 |
38.6 |
37 |
50.8 |
|
No |
40.9 |
52.8 |
61.4 |
63 |
49.2 |
Do you receive benefits from your job?
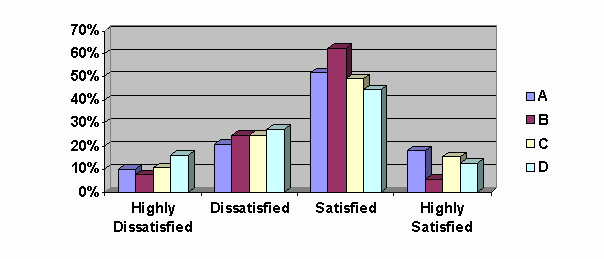
The following questions related to job satisfaction were asked to consumers. In these responses, participants responded from strongly dissatisfied to strongly satisfied. The resultant mean satisfaction level is based on a four-point scale.
How satisfied are you with the kind of work you do?
|
A (n=309) |
B (n=52) |
C (n=88) |
D (n=91) |
Overall |
|
|
Mean Range |
3.35 |
2.94 |
3.07 |
3.1 |
3.22 |
How satisfied are you with the kind of work you do?
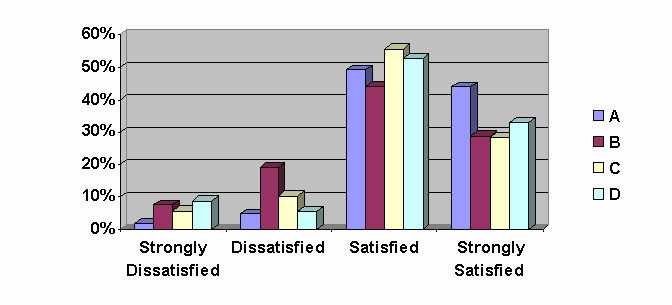
Those who achieved positive employment outcomes (group A) were, on average, more satisfied with their work. As is usual for the general population and reflected on the graph below, consumers of Vocational Rehabilitation services would often prefer to earn higher salaries. However, similar to last year, those consumers representing category A were slightly more satisfied with their salary than other consumers.
How satisfied are you with the salary you receive for the type of work you do?
|
A (n=306) |
B (n=53) |
C (n=85) |
D (n=88) |
Overall |
|
|
Mean Range |
2.78 |
2.66 |
2.69 |
2.53 |
2.71 |
How satisfied are you with the salary you receive?
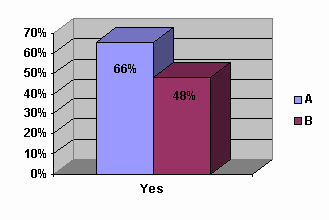
Consumers who received services from the Department were asked if they felt that the services they received through Vocational Rehabilitation helped prepare them for their jobs. Approximately two-thirds (65.5%) of those achieving positive employment outcomes felt that Vocational Rehabilitation services did, indeed, help them. Almost half (48.1%) of those in Group B felt that Department services were of help. This is a significant increase from last year.
Did vocational rehabilitation services help prepare you for a job?
|
A % (n=304) |
B % (n=52) |
Overall |
|
|
Yes |
65.5 |
48.1 |
62.9 |
|
No |
34.5 |
51.9 |
37.1 |
Did VR services help prepare you for a job?
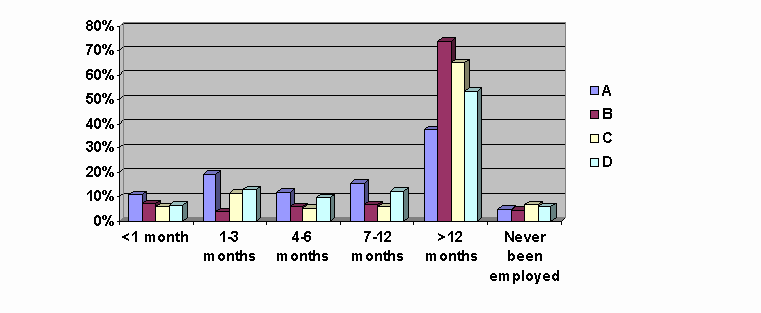
Those who reported being unemployed were asked how long they had been unemployed. Over one-third of the consumers who had achieved a positive employment outcome (group A) who were not currently employed answered that they had not had a job for longer than one year. The percentages of those who had not worked for over a year were much higher for those representing the three other unsuccessful groups. When asked the reason for current unemployment, the majority of the respondents across all closure statuses stated that they could not work because of their disability or physical limitations.
How long have you been unemployed?
|
A % (n=83) |
B % (n=137) |
C % (n=134) |
D % (n=110) |
Overall |
|
|
< 1 Month |
10.8 |
0.7 |
6 |
6.5 |
5.5 |
|
1-3 Months |
19.3 |
8.8 |
11.2 |
12.9 |
12.4 |
|
4-6 Months |
12 |
5.8 |
5.2 |
9.4 |
7.7 |
|
7-12 Months |
15.7 |
6.6 |
6 |
12.2 |
9.5 |
|
> 12 Months |
37.3 |
73.7 |
64.9 |
53.2 |
59.4 |
|
Never Been Employed |
4.8 |
4.4 |
6.7 |
5.8 |
5.5 |
Reason you are currently unemployed
|
A % (n=78) |
B % (n=136) |
C % (n=134) |
D % (n=136) |
Overall |
|
|
Laid off/Fired |
6.4 |
1.5 |
4.5 |
11 |
5.8 |
|
Disabled |
26.9 |
41.9 |
51.5 |
34.6 |
40.1 |
|
Child Care |
3.8 |
3.7 |
3.7 |
2.9 |
3.5 |
|
Can't Find Work |
6.4 |
5.9 |
1.5 |
8.1 |
5.4 |
|
Physical Limitations |
33.3 |
20.6 |
13.4 |
12.5 |
18.4 |
|
In School |
10.3 |
6.6 |
6.7 |
18.4 |
10.5 |
|
Transportation |
1.3 |
2.2 |
0 |
2.2 |
1.4 |
|
Other |
11.5 |
17.6 |
18.7 |
10.3 |
14.9 |
Case Closure
The act of closing a consumer’s case ends the formal contact the counselor has with a consumer. The following information reflects consumers’ responses to questions regarding the closure of their cases.
Overall, 63.5% of consumers indicated that they were informed when their cases were closed. The following table shows the differences in the consumer being informed based on his or her case closure status. Like last year, consumers whose cases were closed upon achieving a positive employment outcome (group A) were most informed about their case closure. Also like last year, those who had cases closed in referral/applicant/extended evaluation (group D) were least informed.
I was informed when my case was closed.
|
A % (n=380) |
B % (n=188) |
C % (n=203) |
D % (n=214) |
Overall |
|
|
Yes |
73.7 |
58 |
58.6 |
54.7 |
63.5 |
|
No |
26.3 |
42 |
41.4 |
45.3 |
36.5 |
I was informed when my case was closed.
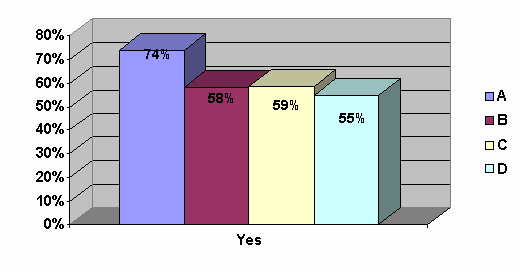
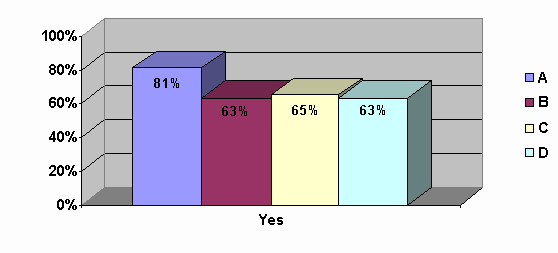
Consumers were asked whether or not they felt their cases should have been closed. If the consumers were in group A, they were more likely to agree that the case should have been closed (80.9%). Those belonging to group B were most likely to want their cases left open (36.8%).
Should your case have been closed?
|
A % (n=377) |
B % (n=182) |
C % (n=206) |
D % (n=207) |
Overall |
|
|
Yes |
80.9 |
63.2 |
65 |
63.3 |
70.5 |
|
No |
19.1 |
36.8 |
35 |
36.7 |
29.5 |
Should your case have been closed?
If the respondent felt his or her case should not have been closed, the follow up question, "Why shouldn’t your case have been closed?" was asked. The responses included: "insufficient services" (32.5%), "rehab did not help me" (21%), "don't have a job yet" (20.4%), "need more training" (13.4%), and "was not finished" (12.7%).
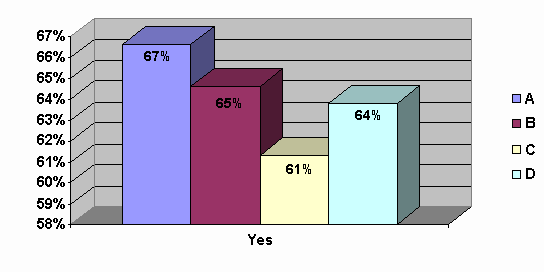
Consumers were asked about their level of awareness of reapplying for services. Approximately two out of three respondents knew they could reapply. Those with cases closed with a positive employment outcome felt most informed in this respect. Those with cases closed prior to initiation of IPE (group C) were the least aware that they could reapply for services.
I know that I can reapply for services from Vocational Rehabilitation.
|
A % (n=401) |
B % (n=195) |
C % (n=217) |
D % (n=229) |
Overall |
|
|
Yes |
66.6 |
64.6 |
61.3 |
63.8 |
64.5 |
|
No |
33.4 |
35.4 |
38.7 |
36.2 |
35.5 |
I know that I can reapply for services.
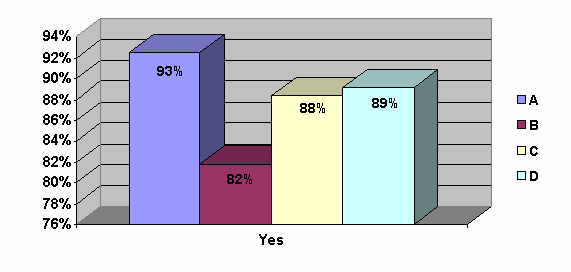
The final question asked to consumers was whether or not they would return to the Department in the future. Nearly 90% of consumers indicated that they would return to Vocational Rehabilitation if needed. Consumers who achieved a positive employment outcome (group A) gave the Department the highest rating on this question at 92.5%. Those whose cases were closed after initiation of the IPE (group B) gave the lowest rating of 81.8%.
I would go back to Vocational Rehabilitation if I needed to.
|
A % (n=399) |
B % (n=192) |
C % (n=215) |
D % (n=230) |
Overall |
|
|
Yes |
92.5 |
81.8 |
88.4 |
89.1 |
88.9 |
|
No |
7.5 |
18.2 |
11.6 |
10.9 |
11.1 |
I would go back to Vocational Rehabilitation if I needed to.
Consumer Trends
We have collected five consecutive years of data as part of the annual consumer satisfaction survey. In this section of the report, responses to some questions over time are reviewed.
Overall Service
Some variations in scores related to overall service quality have occurred over the past five years. There have been slight increases for those in groups A (1.5%) and C (0.8%). Group B experienced a 5% decline in satisfaction with overall service quality. Those in Group D a 3.8% decrease in this measure since 1997.
Satisfaction with Overall Service
|
Closure Category |
1997 Mean Rating |
1998 Mean Rating |
1999 Mean Rating |
2000 Mean Rating |
2001 Mean Rating |
|
A |
3.48 |
3.54 |
3.54 |
3.54 |
3.54 |
|
B |
3.29 |
3.22 |
3.24 |
3.13 |
3.09 |
|
C |
3.14 |
3.28 |
3.32 |
3.28 |
3.17 |
|
D |
3.25 |
3.16 |
3.25 |
3.17 |
3.1 |
Specific Services
Consumers who have achieved positive employment outcomes have reported gains in satisfaction with nearly all services since 1997. Those services experiencing the greatest gains were transportation (0.16), advocacy services (0.15), and the Carl D. Perkins Comprehensive Rehabilitation Center (0.13). Satisfaction with mental health services has decreased slightly (0.01) since 1997.
Employment
Those with positive employment outcomes have experienced a 5% increase in full-time employment. This is the only group to achieve positive gains over time in this area. In addition, consumers in group A have become increasingly satisfied with the type of work they do in their jobs.
An interesting question over the years has been whether or not consumers felt that Vocational Rehabilitation played a part in getting their current jobs. The question was initially worded "Did Vocational Rehabilitation services help you get your current job?" It would be expected that people who had achieved positive employment outcomes would agree. However, responses did not indicate this. The construction of the question was reviewed and it was felt that the wording of the question may not have been clear. For the 2001 survey, the construction of the question was altered slightly without changing the overall content it reflects. The new question is "Do you feel that Vocational Rehabilitation services helped prepare you for a job?" The graph below shows the impact that this rewording had on responses for people with positive employment
outcomes.
Another indication of satisfaction with Vocational Rehabilitation services is whether or not the consumer would return to the Department in the future, if needed. Since 1997, between 92% - 93% of those with positive employment outcomes have indicated that they would come back to the Department. Though there have not been large increases associated with this indicator, it shows a consistently high level of agreement over time.